
By: Aishwarya Pathak
Edited By: Maddie Miele
Abstract
American public schools serving English language learners face an insurmountable funding crisis that local property taxes cannot solve. English Language Learners (ELL) are students whose primary language is not English and who require language support. Analysis of 879 county based school districts reveals that districts with 30 percent English language learners would need to triple their property tax rates, an economic and political impossibility, just to approach adequate funding levels. This study makes two critical findings: First, each 10 percent increase in English language learners correlates with a 13.3 percentage point decline in funding adequacy, even after controlling for poverty and local tax effort. Second, while higher property taxes do improve funding (7.45 percentage points per 1 percent tax increase), this relationship is far too weak to overcome the systematic underfunding of high need populations. These findings demand immediate federal intervention through a tenfold increase in Title III funding and fundamental state level formula reforms that acknowledge the true cost of educating America’s fastest growing student population.
Introduction: When Local Effort Meets Impossible Math
In McAllen, Texas, homeowners pay property taxes at rates 40 percent above the national average. Their schools remain underfunded by 72 percent of what education experts calculate they need to provide an adequate education.1 The reason lies not in lack of local effort, but in the impossible mathematics of educating a student body that is 95 percent minority and 35 percent ELL through property taxes alone.
This stark reality in McAllen reflects a nationwide crisis hiding in plain sight. Across America, 5.1 million English language learners, the fastest growing segment of the K through 12 population, attend schools that are systematically and severely underfunded.2 The conventional wisdom holds that communities can tax themselves sufficiently to fund their schools. This study of 879 county based school districts definitively refutes that assumption, revealing that the mathematics of local property tax funding fundamentally breaks down when serving high concentrations of students with additional educational needs.
The implications extend far beyond individual communities. As America becomes increasingly diverse, with English language learners projected to comprise 25 percent of all students by 2030, the inability of local funding to serve these populations threatens both economic competitiveness and foundational principles of equal opportunity.3
Background: The Property Tax Paradox
American public education finance rests on a seemingly logical premise articulated by economist Charles Tiebout in 1956: Communities can achieve their desired level of public services by choosing where to live and how much to tax themselves.4 Under this model, families who value education, highly, will cluster in communities with robust schools and higher taxes, while those preferring lower taxes can choose more modest educational offerings.
This theory underpins a system where local governments provide 45 percent of total education funding, with property taxes constituting 70 percent of this local contribution.5 In practice, however, this creates dramatic inequalities. Higher-value property districts can generate substantial revenues with modest tax rates, while lower-value property districts cannot generate adequate funding even with crushing tax burdens.
Courts have recognized this fundamental inequity. Since California’s Serrano v. Priest decision in 1971, plaintiffs have prevailed in 27 states, forcing legislative reforms.6 Yet disparities persist, particularly for districts serving low-income areas whose educational costs far exceed what standard formulas recognize.
Methods: Isolating the Effect of Tax Effort
This study examines 879 county based school districts across 12 states where school district boundaries align perfectly with county boundaries. This alignment eliminates the confounding effect of overlapping tax jurisdictions, allowing clean identification of how local tax effort relates to funding adequacy.7
Data came from three sources: Effective property tax rates from the Tax Foundation (2023), funding adequacy measures from the School Finance Indicators Database (2021), and demographic data from the U.S. Census.8
The analysis employs multivariate regression to examine how property tax rates correlate with funding adequacy while controlling for population, income, poverty, and student demographics. The model specification is:
Adequacyi = β0 +β1(TaxRatei)+β2(ELL%i)+β3(Povertyi)+Xiγ + State FE +ϵi
where Xi represents additional demographic controls and State FE (state fixed-effect variable) captures state level policy differences.
Findings: Two Insurmountable Challenges
4.1 Finding 1: English Language Learners Face Catastrophic Underfunding
The analysis reveals a devastating relationship between ELL concentration and funding adequacy that no reasonable level of local taxation can overcome.
Table 1: The Compounding Crisis of ELL Underfunding
|
District Characteristic |
Effect on Adequacy Gap |
Statistical Significance |
|
English Learners (+10%) |
−13.3 percentage points |
p = 0.020 |
|
Special Education (+10%) |
−5.3 percentage points |
p = 0.064 |
|
Minority Students (+10%) |
−2.3 percentage points |
p = 0.052 |
|
Child Poverty (+10%) |
−17.5 percentage points |
p = 0.001 |
The magnitude of the ELL coefficient demands attention. A district with 30 percent ELL students, common in border states and urban centers, faces a funding gap 40 percentage points worse than a district with no ELL students, holding all else constant. This translates to approximately $4,000 less per pupil in a typical district, a gap that compounds annually throughout a student’s education.9
Consider the real world implications through three representative districts from the sample: Table 2: Three Districts, Three Realities
|
Suburban MD |
Rural AL |
Border TX |
|
|
Property Tax Rate |
1.2% |
0.4% |
0.9% |
|
English Language Learners |
2% |
1% |
35% |
|
Minority Students |
15% |
65% |
95% |
|
Funding Adequacy |
+12% |
−35% |
−72% |
The Texas border district taxes itself at above average rates yet faces catastrophic underfunding. Even if this district tripled its property tax rate to 2.7 percent, which would make it the highest taxed district in America and likely trigger economic collapse, it would still fall short of adequacy.
This finding challenges fundamental assumptions about local control and educational opportunity. When the accident of geography, being born in a border county versus a suburban enclave, determines whether a child receives 28 percent or 112 percent of adequate educational resources, the system fails basic tests of fairness and economic efficiency.
4.2 Finding 2: The Property Tax Adequacy Relationship Is Too Weak
While higher property taxes do correlate with improved funding adequacy, the relationship is far weaker than commonly assumed and wholly insufficient for high need districts.
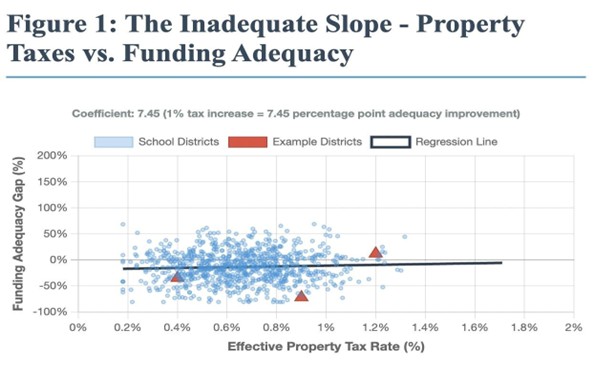
Figure 1: The Inadequate Slope: Property Taxes vs. Funding Adequacy. Each point represents one of 879 county based school districts. The regression line shows that a 1% increase in property tax rates improves funding adequacy by only 7.45 percentage points, far insufficient to close the average 13.54% gap (Source: Author’s analysis).
The regression coefficient of 7.45 means that a one percentage point increase in the effective property tax rate improves funding adequacy by 7.45 percentage points.10 To understand this relationship’s inadequacy, consider what closing the average funding gap would require:
- The average district faces a negative 13.54% adequacy gap
- Current average property tax rate: 0.66%
- Required tax rate to close gap: 2.48%
- This represents a 276% tax increase
For low-income areas, the mathematics become absurd. A district with 30 percent English language learners facing a negative 50 percent adequacy gap would need property tax rates exceeding 7 percent, higher than any jurisdiction in American history and economically destructive to any community that attempted it.
Moreover, this analysis likely overestimates what local taxation can achieve. The positive correlation between tax rates and adequacy may partly reflect reverse causality (wealthy districts with better outcomes can sustain higher taxes) and omitted variables (communities that value education may both tax more and provide non tax support).11
Policy Implications: Federal Intervention as Necessity, Not Choice
These findings demolish the myth that local communities can tax their way to educational adequacy. When districts serving ELL would need economically impossible tax rates just to approach adequate funding, the failure is systemic, not local. This reality demands fundamental policy reforms at federal and state levels.
5.1 Federal Action: A Tenfold Increase in Title III
The federal government currently provides $737 million annually for ELL support through Title III of the Elementary and Secondary Education Act, less than $150 per ELL student.12 This token amount mocks the genuine needs revealed in this analysis.
Congress should immediately increase Title III funding to $7.5 billion annually, providing approximately $1,500 per ELL student. While this tenfold increase may seem dramatic, it merely begins to address the $4,000 per pupil gap facing high ELL districts. The federal government spends more subsidizing agricultural corporations than ensuring millions of American children receive adequate education.13
Beyond increased appropriations, Congress should create categorical grants for districts where ELL students exceed 20 percent of enrollment. These grants would recognize that concentrated ELL populations create unique challenges requiring specialized programs, teacher training, and family support services that standard per pupil allocations cannot address.
5.2 State Reform: Acknowledging True Costs
States must fundamentally recalibrate funding formulas to reflect educational reality rather than political convenience. Current weighted funding formulas assign ELL an average weight of 1.2, suggesting these students cost 20 percent more to educate than native English speakers.14 This analysis suggests the true cost is 200 to 250 percent higher.
States should immediately:
- Commission adequacy studies using successful schools serving ELL populations as bench-marks
- Implement ELL weights of 2.0 to 2.5 in funding formulas
- Create “concentration factors” providing additional funding when ELL students exceed 15 percent
- Establish circuit breaker programs protecting low income homeowners while enabling higher local tax efforts
California’s Local Control Funding Formula, which provides supplemental and concentration grants for high need students, offers a model, though even California’s weights remain insufficient given my findings.15
Limitations and Future Research
This cross sectional analysis cannot definitively establish causation. Districts may raise taxes in response to identified inadequacies, and unmeasured factors like community education preferences may influence both variables. Future research should exploit quasi experimental variation from court decisions or formula changes to identify causal effects.16
Additionally, focusing on county based districts, while methodologically clean, may limit generalizability. Future studies should examine whether similar patterns hold in the 93 percent of districts with different governance structures.
Conclusion: The Moral Urgency of Federal Action
This analysis of 879 county based school districts reveals a harsh truth: local property taxes cannot generate adequate funding for districts serving high concentrations of ELL and other high need students. The mathematics simply do not work. Districts would need to impose economically destructive tax rates just to approach adequacy, and even then would fall short.
This is not a failure of local will but of system design. When McAllen, Texas taxes itself above the national average yet remains underfunded by 72 percent while wealthy suburban districts enjoy surpluses, the inequity is structural and demands federal intervention.
The path forward is clear if politically difficult. Congress must dramatically increase Title III funding, states must reform formulas to reflect true costs, and local districts must be freed from the impossible expectation that property taxes alone can fund adequate education for all students.
The alternative, continued systematic underfunding of ELL, guarantees educational failure for millions of children who represent America’s demographic and economic future. In 2023, one in four American children spoke a language other than English at home.17 By 2030, ELL will comprise 25 percent of all K through 12 students. Their success or failure will determine America’s economic competitiveness, social cohesion, and democratic vitality.
The evidence presented here demonstrates that local tax effort, however vigorous, cannot overcome the systematic underfunding of high need students. Federal and state policymakers face a choice: Act on this evidence or accept responsibility for perpetuating an education finance system that fails millions of American children simply because of where they live and what language they speak at home.
Works Cited
- Bruce D. Baker, Matthew Di Carlo, and Mark Weber, “The Adequacy and Fairness of State School Finance Systems: Key Findings from the School Finance Indicators Database,” Educational Policy 35, no. 7 (2021): 1078–1121.
- Migration Policy Institute, English Learners in U.S. Schools: Key Statistics, Fact Sheet (Washington, DC: Migration Policy Institute, 2023).
- National Center for Education Statistics, English Learners in Public Schools (Washington, DC: U.S. Department of Education, 2022).
- Charles M. Tiebout, “A Pure Theory of Local Expenditures,” Journal of Political Economy 64, no. 5 (1956): 416–424.
- U.S. Census Bureau, Annual Survey of State and Local Government Finances, Technical Report (Washington, DC: U.S. Department of Commerce, 2023).
- Serrano v. Priest, 5 Cal.3d 584 (1971); Michael A. Rebell, “Professional Rigor, Public Engagement and Judicial Review: A Proposal for Enhancing the Validity of Education Adequacy Studies,” Teachers College Record 109, no. 6 (2007): 1303–1373.
- Christopher R. Berry, “Imperfect Union: Representation and Taxation in Multilevel Governments,” American Political Science Review 103, no. 3 (2009): 459–476.
- Tax Foundation, Property Tax Rates by County and City, 2023 (Washington, DC: Tax Foundation, 2023); Baker, Di Carlo, and Weber, “Adequacy and Fairness of State School Finance Systems.”
- Author’s calculations based on regression coefficients and average per pupil spending of $10,000.
- Coefficient marginally significant at p = 0.052, suggesting relationship exists but with considerable uncertainty.
- William Duncombe and John Yinger, “How Much More Does a Disadvantaged Student Cost?” Economics of Education Review 24, no. 5 (2005): 513–532.
- U.S. Department of Education, Fiscal Year 2023 Budget Request (Washington, DC: U.S. Department of Education, 2023).
- Environmental Working Group, Farm Subsidy Database (Washington, DC: EWG, 2023).
- Bruce D. Baker, Mark Weber, and Ajay Srikanth, School Finance Reform, the Distribution of School Spending, and the Distribution of Student Test Scores (Washington, DC: Albert Shanker Institute, 2022).
- Julien Lafortune, Jesse Rothstein, and Diane Whitmore Schanzenbach, “School Finance Reform and the Distribution of Student Achievement,” American Economic Journal: Applied Economics 10, no. 2 (2018): 1–26.
- Caroline M. Hoxby, “All School Finance Equalizations Are Not Created Equal,” Quarterly Journal of Economics 116, no. 4 (2001): 1189–1231.
- Annie E. Casey Foundation, Kids Count Data Book 2023 (Baltimore: Annie E. Casey Foundation, 2023).
Author Bio

Aishwarya Pathak holds a Master of Public Administration from the Maxwell School of Citizenship and Public Affairs at Syracuse University, where she specialized in data analytics for public policy. Her academic training combines advanced statistical methods, machine learning techniques, and policy analysis to address complex challenges in public administration. Pathak focuses on leveraging big data and predictive analytics to improve government decision-making and evaluate program effectiveness. At Syracuse, she developed expertise in R, Python, and statistical software for policy analysis, combining technical proficiency with a deep understanding of public sector challenges. Pathak is passionate about making data analytics accessible to policymakers and using quantitative methods to identify and address systemic inequities.