
Written by Erwin Chen
Edited by Eghosa Asemota
Anthropogenic climate change, the increase in average atmospheric temperature on Earth attributed to the production of greenhouse gases emitted by human activity, is causing increasingly more harm globally.[1],[2],[3] The atmospheric concentration of carbon dioxide (CO2) has increased by forty percent since pre-industrial times, causing the global mean temperature to rise by 0.7℃.[4] As of 2017, fossil fuels supply about eighty percent of energy consumption in the United States, a trend that is unlikely to change in the future without any actions.[5] When fossil fuels are used to generate energy, they release carbon dioxide (CO2) and other greenhouse gases into the atmosphere. The Earth’s temperature is regulated by a greenhouse effect that occurs when sunlight reaches Earth and is absorbed or released as heat. When additional greenhouse gases are emitted, they increase the atmospheric temperature by absorbing energy and preventing the release of heat into space. This occurrence is exacerbated by deforestation and landscape changes that have reduced Earth’s natural ability to absorb CO2 which has led to detrimental consequences.[6] In the United States, particularly, the warmer climate has led to more extreme weather events, threats to agriculture and public health, and in turn substantial social costs. In 2015, it was estimated that the CO2 emissions and equivalents incurred a social cost of $36 per metric ton (three percent discount rate) to the American public, totaling more than $5 billion.[7]
The price of fossil fuels that consumers face is not sufficient to cover the hidden social cost of carbon. The gap between the current level of fossil fuel consumption and the socially optimal level of consumption creates a negative externality for society. Government intervention in the form of policies such as a carbon tax would help consumers of fossil fuels internalize the social cost of carbon and reduce this negative externality. Three policies are considered in this analysis. The first is the Clean Power Plan, America’s current policy. The second, a policy alternative, levies a carbon tax and uses the revenue to reduce the highest marginal corporate income tax rate. The third policy levies a carbon tax and distributes the revenue among Americans. The current policy and two policy alternatives are evaluated in terms of their ability to 1) combat climate change (reduce CO2); 2) minimize economic damage (employment, GDP, and competitiveness among U.S. companies); 3) establish equity (fairness toward low-income and rural households); and 4) be politically feasible (garner public and electoral support). The analysis reveals that of the three options, a carbon tax coupled with a lower marginal corporate income tax would be the best alternative.
The Consequences of Climate Change
One of the most visible consequences of climate change is seen in the frequency of extreme weather events. Extreme weather events– such as heat waves, droughts, wildfires, extreme rainfall, winter precipitation, hurricanes, tornadoes, and floods– are defined as the most unusual ten percent of weather events based on historical records.[8] Climate change has exacerbated the incidence of these events.[9] For example, the southwestern United States experienced higher than average temperatures between 2000 and 2015.[10] High temperatures accelerate the evaporation of water which causes the land to retain less water and become more prone to drought. For multiple years between 2000 and 2015, almost 100 percent of land in the Southwest was in abnormally dry conditions or worse.[11] The same period was the driest period ever since 1895. In contrast, because warmer air contains more water vapor, the denser atmosphere causes more storms and extreme rainfalls. Nine of the top ten record years for extreme one-day precipitation events in the United States have occurred since 1990.[12] While southwestern states are experiencing the driest period in their history, the Midwest and Northeast are receiving record high numbers of extreme rainfalls. [13] In the Midwest and Northeast, river flooding coincides with heavy precipitation and poses a great threat to local residents.[14] Hurricanes and other tropical storms are also becoming more frequent and intensive in the United States.[15]
The impact of climate change extends beyond climate and weather. A warmer climate could significantly challenge agriculture in the United States.[16] In the Northeast, more frequent and intense heavy precipitation events are accelerating land erosion.[17] By washing away topsoil, land erosion reduces the productivity of land and causes a series of problems such as salinization and soil acidity. Agricultural production in the Southwest would also decrease due to dry land conditions. Since most agriculture in the Southwest is in the form of raising livestock, a warmer climate could, for example, reduce feed-grain production and the quality of pastures as well as exacerbate disease and pest distributions.[18] The costs of weed control and raising livestock increase as the global temperature rises.[19] A warmer climate would exacerbate diseases for both crops and livestock.[20] Climate change has dire implications for public health given its ability to cause food and water shortages which would impact the most vulnerable populations.[21] Higher incidence of respiratory diseases, such as asthma, among children and elderly people have been documented as a consequence of climate change.[22] More frequent extreme weather events would cause more injuries to the American public. Climate change would also transform America’s topography and biodiversity in irreversible ways. More than ninety percent of coastal parks are threatened by rising sea levels.[23] A warmer climate would increase the frequency and intensity of natural fires, which endanger many natural habitats.[24]
Evaluating Current Policy: The Clean Power Plan (CPP)
The Clean Power Plan (CPP) is a program developed by the United States Environmental Protection Agency (EPA) that limits carbon emissions from power plants. The plan contains two separate sets of standards for natural gas and coal, which combined produce about sixty-five percent of electricity in the United States[25]. Electricity generated by natural gas is limited to emit 1,000 pounds (450 kg) of CO2 per megawatt-hour on a gross output basis.[26] Similar limits are set for coal-burning power plants. Electricity generated by coal is limited to 1,400 lb (640 kg) CO2/MWh-gross for newly constructed power plants.[27] The EPA sets a flexible limit or no limit on modified power plants. Reconstructed coal power plants are limited to 1,800 lb (820 kg) CO2/MWh-gross if they have a heat input of greater than 2,000 MMBtu/h (one million British Thermal Units per hour) and 2,000 lb (910 kg) CO2/MWh-gross otherwise.[28] Power plants with a higher heat input burn coal more efficiently and thus have a lower limit. The EPA requires that all power plants use the Emissions Collection and Monitoring Plan System (ECMPS) to report emission data. ECMPS would be available to all power plants at no additional cost.
This CPP allows states to be flexible with their strategies. The EPA recognizes that the power networks in the United States are intertwined across states. Therefore, the EPA allows states to trade emission credits from each other and thus pursue multi-state approaches. In addition, the EPA establishes three equivalent goals that states can choose to accomplish: 1) a rate-based state goal measured in pounds per megawatt hour (lb/MWh); 2) a mass-based state goal measured in total short tons of CO2; and 3) a mass-based state goal with a new source complement measured in total short tons of CO2. States can seek to make their current power plants more efficient, close down expiring power plants, or switch to clean energy for electricity. The EPA would provide matching funds to help states implement clean energy projects for low-income and rural households.[29]
Combat Climate Change (Low/Medium): Under the CPP, impact on carbon emissions would be low. The EPA estimates that the CPP would reduce carbon emissions by nineteen percent by 2020, twenty-eight percent by 2025, and thirty percent by 2030 relative to 2005 levels.[30] The estimates vary by about one percent, depending on which goals states decide to pursue. However, delay in implementation would significantly undermine these estimates. After implementation, the states would have one year to submit their plans to the EPA.[31] It would take another year for the EPA to evaluate their plans and make final approvals.[32] The U.S. Department of State estimates that the CPP along with other environmental regulations would reduce carbon emissions by sixteen percent by 2025 and eighteen percent by 2030, well below the EPA estimates.[33]
Minimize Economic Damage (Medium): The CPP would reduce employment in the short term but create more jobs in the long term. The EPA estimates that the CPP could result in a net decrease of approximately 25,000 jobs by 2025 under the rate-based goal and approximately 26,000 jobs under the mass-based goal in the electricity, coal, and natural gas sectors.[34] The number of jobs lost increases to 30,900 under the rate-based goal and 33,700 under the mass-based goal by 2030. However, the CPP encourages states to adopt programs that would increase energy efficiency and promote growth in the clean energy sector. The number of jobs created in these programs ranges from 37,570 to 59,700 jobs in 2020, 52,590 to 83,590 jobs in 2025, and 52,440 to 83,360 jobs in 2030 regardless of whether the rate-based and mass-based goals are used to evaluate the impact on employment.[35] The negative impact of the CPP on employment disappears in less than a decade. In the end, the CPP would increase employment by roughly 20,000 to 50,000 jobs.
Additionally, the CPP would have a slightly negative impact on long-term GDP. The U.S. Energy Information Agency (EIA) estimates that the cumulative negative effect of the CPP on the GDP of the United States is between 0.15 percent and 0.25 percent over the period of 2015-2040 relative to 2015.[36] In dollar amounts, the CPP would cost the United States between $700 billion and $1,000 billion (2009 dollars) over the next three decades.[37] The short-term impact on GDP is likely minimal because the electricity costs would not change substantially. Although the CPP would increase the cost of electricity in the short term, it would save energy cost in the long term. The total energy saving is estimated to be $2.1 billion in 2020, $16.7 billion in 2025, and $26.3 billion in 2030.[38] The lower cost of electricity would help energy-intensive corporations.
Equity (Medium): The CPP has minimal impact on low-income households and the rural population. Although the electricity bill would temporarily increase by 2.7 percent by 2020, it would become cheaper by seven percent by 2030. The matching fund provided by the CPP would help low-income and rural households adopt clean energy and further lower their electricity expenses. The CPP does not have a direct impact on fuel costs and thus has little impact on the cost of transportation for rural households.
Feasibility (Medium): The political feasibility of the CPP is medium. The EPA enforces the CPP with its own authority and does not need congressional approval. However, multiple political leaders have openly opposed the CPP, most noticeably President Trump.[39] There is also an ongoing legal battle surrounding the CPP. The Supreme Court stayed implementation of the CPP in early 2016.[40] Even if it survives these legal and political tensions, the CPP requires at least $1.4 billion in 2020, $3.0 billion in 2025, and $5.1 billion in 2030 for its implementation.[41] The current administration is not likely to fund the CPP.
Policy Alternative: Carbon Tax with Lower Corporate Tax Rate
Should a carbon tax be used to reduce the corporate income tax? Currently, there is bipartisan interest in corporate tax reform. The top statutory corporate income tax rate for U.S. corporations is 39.1 percent while the weighted average is only twenty-nine percent in other Organization for Economic Cooperation and Development (OECD) countries.[42] Recently, many OECD countries have reduced their highest marginal corporate income tax rate, while the tax rate has increased in the United States.[43] As a result, the United States now has the highest marginal corporate income tax among the industrialized countries. The high marginal corporate income tax rate has had a negative impact on the U.S. economy and reduces the global competitiveness of U.S. corporations.[44] Specifically, it makes the United States less competitive in attracting capital investments and creates an incentive for multinational corporations to shift their profits and operations overseas.[45] Further, the corporate income tax is inefficient. In 2015, the total expected revenue from corporate income tax was $401 billion but cost U.S. corporations $140 billion to comply with the tax.[46],[47],[48] Reducing the corporate tax rate, however, would cause federal and state governments to lose revenue. Revenue from a carbon tax would be relatively larger than the current revenue from corporate income tax.[49] Therefore, a potential swap between a carbon tax and corporate income tax is fiscally feasible.
Under this alternative, carbon would be priced initially at $21 (in 2016 dollars) per metric ton during the first year of implementation, starting in 2017. The price would increase by about five percent every year as the highest marginal corporate income tax rate is gradually lowered to twenty-eight percent. The annual increase in the price needs to be at least two percent faster than inflation. The carbon tax would reach its highest price around 2030 and be adjusted to keep up with inflation afterward. The tax would be collected upstream at initial sources of fuel production based on the carbon content: petroleum would be taxed at its refinery, coal would be taxed at the mines along with the federal excise tax, and natural gas would be collected on natural gas wells or processors. The upstream collection would cover ninety percent of carbon emissions and reduce administrative costs.[50] All fuels, energy, and energy-intensive goods imported from other countries would be taxed at the same rate based on their carbon content.
Revenue from this tax would be used for two purposes. Three-quarters of the revenue will be used to fund a corporate tax reform. The reform would lower the highest marginal corporate tax rate as well as increase the efficiency and certainty of the corporate tax code. During the initial transition period, before 2020, $1.4 billion to $2.5 billion annually would be used to help coal and natural gas power plants lower their emissions and increase their efficiency. Second, the rest of the revenue will provide tax credits for individuals who are most hurt from this tax. Carbon priced at $20 per ton would amount to 2.5 percent increase in expenses for households in the bottom twenty percent income scale, but only 0.7 percent for households on the top twenty percent.[51] Rural families also drive on average 10,000 miles more than urban families.[52] By 2025, tax credits of $160, $150, $140, and $100 would be issued to individuals in the first four income quintiles respectively. Rural low-income households would also receive up to $80 of tax credits to assist with their transportation needs.
Combat Climate Change (Medium): Impact of the carbon tax under this alternative on carbon emissions would be medium. Assuming that implementation started in 2017 and the tax stayed constant at $21 per metric ton, carbon emissions would be reduced by twenty-four percent by 2020, twenty-six percent by 2025, and twenty-eight percent by 2030.[53] By 2025, the price of $21 per ton plus the five percent annual growth rate would reduce carbon emissions by twenty-eight percent.[54] A corporate tax reform would likely reduce the economic incentive to lower carbon emissions for some corporations. However, taking corporate tax reform into account and using a three percent annual growth rate, a starting price of $17 per ton is already sufficient for this alternative to lower carbon emissions by twenty-eight percent by 2030.[55] The U.S. Congressional Budget Office (CBO) estimates that the carbon tax in this alternative would reduce carbon emission by ten percent during the first decade after implementation.[56] Therefore, even though the tax increases over time, its effect on carbon emission could be observed in the short term. The pricing schedule needs to be updated if the plan were to be implemented in the future, since the level of carbon in the atmosphere would have necessarily changed.
Minimize Economic Damage (High): The proposal would have a positive effect on the U.S. economy. Employment might decrease in the short term but would recover in a decade. Employment in sectors associated with coal, petroleum, and natural gas would suffer the most under this proposal. Firms in these sectors would receive assistance from the carbon tax revenue to adopt low-emission technologies and increase their efficiency.[57] Furthermore, less energy-intensive and clean energy firms would thrive under the proposal, as their corporate tax would be significantly lower. In 2017, over one million Americans worked in traditional coal, oil, and gas companies, while almost 800,000 worked in the clean energy industry.[58] The number of clean energy jobs in the United States has an annual growth rate of nearly six percent since 2012, twelve times faster than the rest of the U.S. economy.[59] If the growth rate were to continue, it would only take a decade to replace all jobs in traditional energy with those in clean energy. Globally, employment in clean energy is expected to double by 2030, sufficient to offset the number of jobs lost in traditional energy.[60] The carbon tax would encourage investment in clean energy. For every $1 billion the economy invests in replacing fossil fuels with clean energy, the employment would increase by 110,000 jobs.[61]
The GDP would also benefit from a lower corporate tax rate. Every one percentage point cut in the average corporate income tax would raise real GDP per capita by 0.4 percent in the first quarter and by 0.6 percent after one year.[62] The annual increase in GDP stabilizes around 0.4 percent. A ten-percentage-point cut on average corporate income tax would increase GDP by 0.7 to 1.1 percent in the long term.[63] Considering the negative effect of a carbon tax on the economy, the long-term expected increase in GDP would be between 0.25 and one percent.[64]A lower corporate tax rate would also increase the competitiveness of U.S. corporations. The carbon tax would provide $1.2 trillion for the next decade, while the current corporate income tax revenue is $470 billion.[65],[66] The revenue from the carbon tax would be sufficient to lower the highest marginal corporate income tax rate to twenty-eight percent in a decade. Lowering the corporate tax rate by ten percent could boost capital investment from U.S. corporations by 2.2 percent in the United States.[67] It would also increase business density per hundred people in the United States by about two percent.[68] The additional investment would help U.S. corporations expand and compete better domestically and internationally.
Equity (Low): The equity of this proposal would be low as the low-income and rural populations are very likely to be harmed. The richest quintile of households would benefit from a lower corporate tax and receive an equivalent tax cut of 0.8 percent.[69] The poorest quintile of households, however, would receive an equivalent tax increase of 1.7 percent.[70] Proposed tax credits to rural and low-income households would reduce their carbon tax burden to less than one percent of their before-tax income.[71] The carbon tax would increase fuel cost by twenty cents per gallon.[72] Rural families would spend on average $200 more on transportation, assuming that the vehicle is a light truck less than 8,500 lbs and meets the average fuel efficiency in 2014.[73] Part of the extra cost would be offset by the proposed $80 tax credits. Although tax credits would ease the burden on low-income and rural households, they would still be slightly worse off than before tax.
Feasibility (Medium): The political feasibility is medium for this proposal. Liberal politicians have traditionally supported the idea of a carbon tax to combat climate change. Recently, several conservative politicians also voiced support for a carbon tax proposal. Corporate tax reform was a popular issue in the 2012 and 2016 presidential election for both parties and has become a priority for the Trump administration. Conservative politicians have long emphasized the need for corporate tax reform. However, the carbon tax would likely face some opposition from the traditional energy sector. The assistance to the traditional energy sector would likely generate more support.
Policy Alternative: Carbon Dividends Plan
A carbon tax with a lower corporate tax rate may help the U.S. economy, but it leaves most Americans financially worse off. Another approach is to use the revenue from a carbon tax to provide an income for every American. Assuming that the plan was put into effect in 2017, this second alternative to the current policy would tax carbon at a higher rate at $40 (in 2016 dollars) per metric ton and divide the revenue equally among the population. The actual increase in the price would be about three percent every year, adjusted according to inflation. The price would reach its peak in 2025. Again, the pricing schedule would need to be updated, based on the level of carbon in the atmosphere at the time of implementation. Similar to the previous alternative, the federal government would collect this tax upstream at initial locations of production to cover the maximum amount of fossil fuels. If emission-reducing technologies are not adopted, then this alternative would impose a tax of $90 per ton of coal (around 150 percent of the average 2016 delivered price), $2.10 per thousand cubic feet of natural gas (around eighty percent of typical 2016 Henry Hub prices), and $17 per barrel of crude oil (around forty percent of the 2016 average price).[74] The high price tag on fossil fuels would significantly reduce the incentive to rely on them for energy. This tax also applies to all imported energy and goods. Goods exported to countries that do not collect a carbon tax would be eligible for tax refunds. The revenue would then be used to pay a quarterly dividend to everyone with a valid social security number. Children under eighteen years old would receive half as much payment as adults. This alternative would reduce carbon emissions and help most Americans financially.
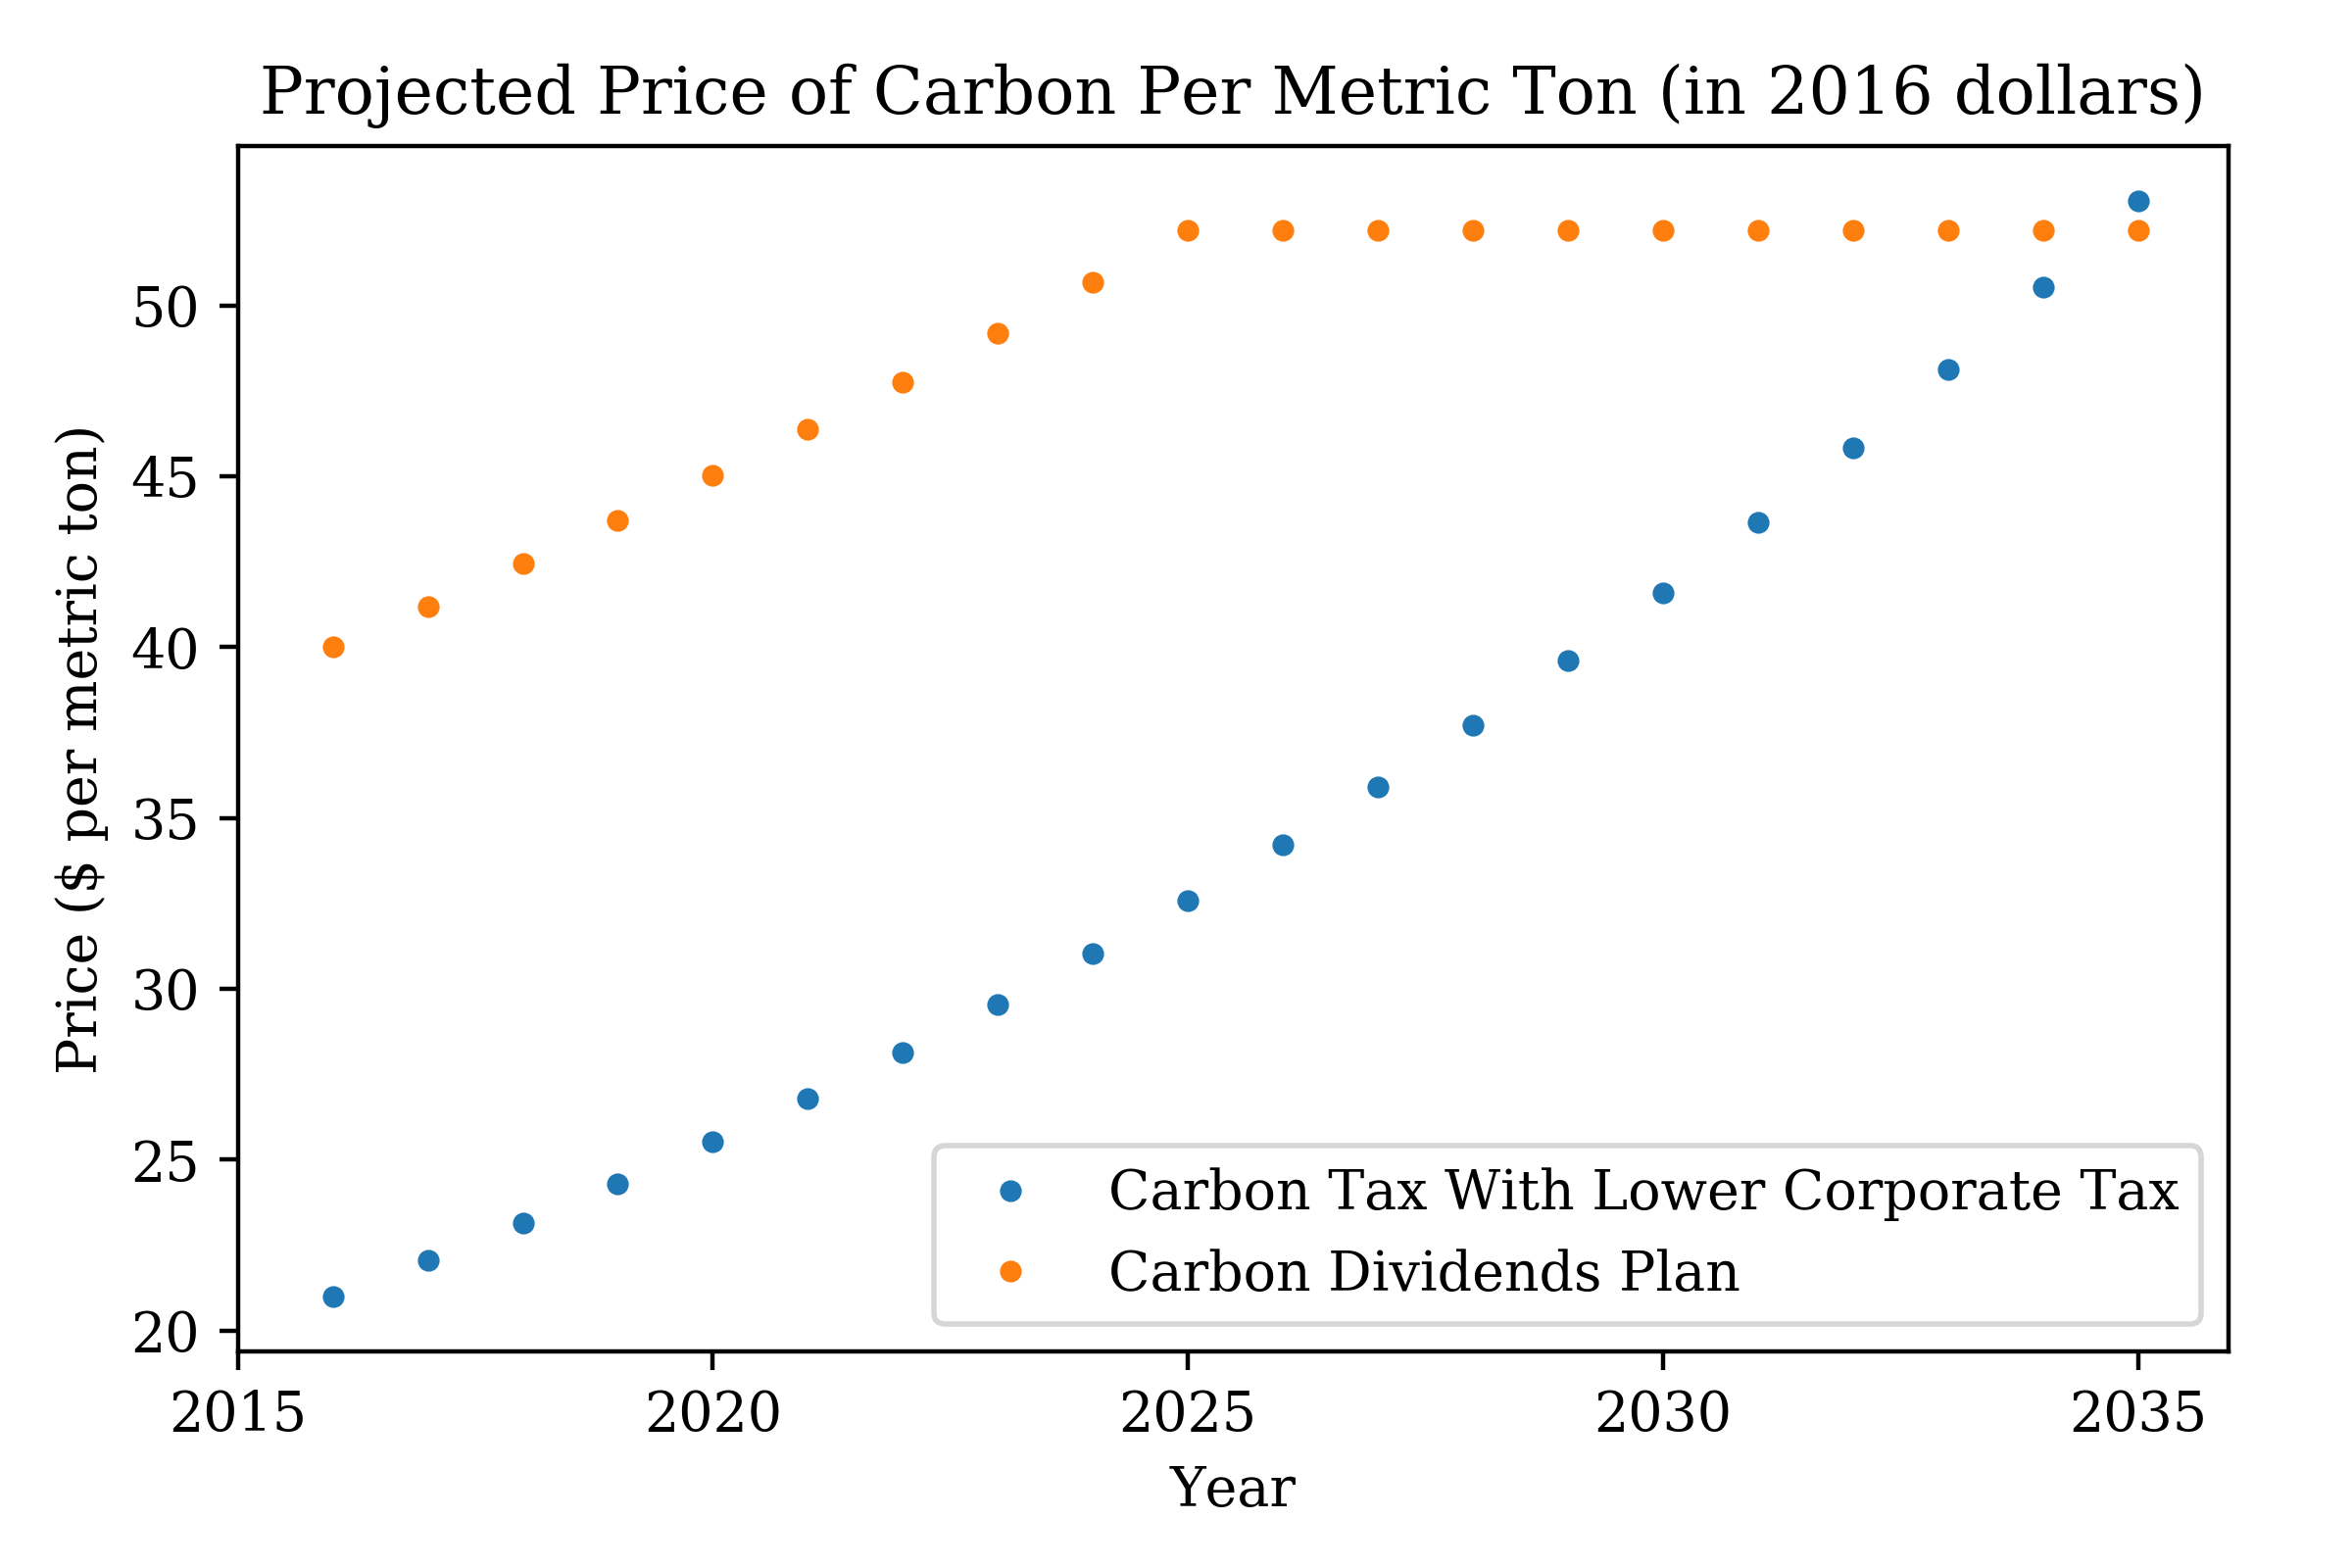 Figure 1: Projections of Carbon Taxes (Carbon Tax With Lower Corporate Tax Rate vs. Carbon Dividends Plan)
Combat Climate Change (High): The impact of this alternative on carbon emissions would be high. The pricing of $40 per metric ton is much higher than $21 per ton under the previous alternative. Dividends to citizens would not significantly reduce the efficiency of a carbon tax at reducing carbon emissions.[75] Even if the current administration repealed all Obama regulatory policies, a constant pricing at $37.68 per ton would be sufficient to reduce carbon emissions by twenty-eight percent.[76]
Minimize Economic Damage (Low): This alternative would have a significant impact on the U.S. economy. The impact on employment would be similar to that of the previous alternative. However, the timeline would be different. The carbon tax in this alternative starts much higher at $40 per ton and creates a greater economic incentive to reduce carbon emissions. Thus, employment in traditional energy would start declining earlier. It is not clear whether the growth of the clean energy sector would be able to offset the number of jobs lost in the initial period of implementation. The impact on GDP would be negative and significant. If the carbon tax in this proposal were set at $30 per ton, this alternative would lower GDP by about one percent by 2020 and four percent in the long term, relative to a 2013 baseline.[77] The dividends would allow average Americans to purchase more products, which could mitigate the economic damage from a carbon tax. However, the overall effect of this proposal on GDP would be negative. This alternative would increase energy expenses and reduce the competitiveness of U.S. corporations. The carbon tax would hurt manufacturing companies the most. Issuing tax refunds to exported U.S. goods and taxing imported foreign goods would help U.S. products maintain their competitiveness. However, the EPA would likely underestimate the carbon content of foreign products, for example, if they fail to take into account carbon emissions that occurred during transportation of raw materials. The rising electricity and fuel price would make corporations costlier to operate in the United States.
Equity (High): The equity of this alternative would be high. Households of higher income cause far more carbon emissions and consume twice as much energy as low-income households.[78],[79] High-income households would pay their fair share of the cost to the environment, while low-income families would receive additional income from the dividends. A family of four would potentially receive $1,000 per year.[80] The bottom seventy percent of Americans on the income scale, 225 million Americans, would benefit from these dividends, making the carbon tax a progressive one.[81]
Feasibility (Low/Medium): The political feasibility of passing this alternative would be low. The current administration has openly opposed the idea of a carbon tax. The economic damage would make it difficult to justify the environmental benefits. The idea of universal income for all Americans is not fully examined in the context of the United States and has little public support. However, if this alternative were adopted, then it might enjoy greater security because a majority of Americans would be financially better off.
A Way Forward
According to this analysis, the carbon tax with the lower marginal corporate income tax would be the best alternative. The proposed alternative would set an initial price of $21 per metric ton on all fossil fuels. The price would increase by five percent every year and reach the highest price by 2030. Three-quarters of the revenue would be used to lower the highest marginal corporate tax rate to twenty-eight percent. The rest would provide low-income and rural households with tax credits to alleviate their tax burdens. Instead of causing economic damage like a traditional carbon tax, this one would create more jobs, spur economic growth, and make U.S. corporations more competitive. Tax credits in the proposal would control the tax burdens of low-income and rural households to within one percent of their before-tax income. The economic benefits would neutralize opposition to the carbon tax. Unlike the current policy, the Clean Power Plan (CPP), this policy alternative would effectively reduce carbon emissions. And unlike the Carbon Dividends Plan, lowering the corporate tax would cause far less economic damage than lump-sum payments to the public. As for political support, coal, natural gas, and oil companies would receive part of the revenue to help increase their efficiency and alleviate their economic damage. The high social cost of carbon, as well as the unreasonably high corporate income tax, can be used as justification for implementing this alternative.
REFERENCES
- U.S. Environmental Protection Agency (EPA). Terms & Acronyms. https://ofmpub.epa.gov/sor_internet/registry/termreg/searchandretrieve/termsandacronyms/search.do ↑
- U.S. The National Aeronautics and Space Administration (NASA). Climate Change Causes. https://climate.nasa.gov/causes/ ↑
- U.S. Global Change Research Program. 2017. Climate Science Special Report. Fourth National Climate Assessment (NCA4), Volume I. https://science2017.globalchange.gov/ ↑
- Intergovernmental Panel on Climate Change (IPCC). 2013. Climate Change 2013: The Physical Science Basis. Contribution of Working Group I to the Fifth Assessment Report of the Intergovernmental Panel on Climate Change. http://www.ipcc.ch/report/ar5/wg1/ ↑
- U.S. Energy Information Administration (EIA). 2018. Annual Energy Outlook. https://www.eia.gov/outlooks/aeo/ ↑
- U.S. Environmental Protection Agency (EPA). Global Greenhouse Gas Emission Data. https://www.epa.gov/ghgemissions/global-greenhouse-gas-emissions-data ↑
- U.S. Environmental Protection Agency (EPA). The Social Cost of Carbon. https://archive.epa.gov/epa/climatechange/social-cost-carbon.html ↑
- National Oceanic and Atmospheric Administration (NOAA). Introduction to Extreme Weather Events. https://www.ncdc.noaa.gov/extremes/cei/introduction ↑
- Center for Climate and Energy Solutions. Extreme Weather and Climate Change. https://www.c2es.org/publications/extreme-weather-and-climate-change ↑
- U.S. Environmental Protection Agency (EPA). Climate Change Indicators: the Southwest. https://www.epa.gov/climate-indicators/southwest ↑
- U.S. Environmental Protection Agency (EPA). A Closer Look: Temperature and Drought in the Southwest. https://www.epa.gov/climate-indicators/southwest ↑
- U.S. Global Change Research Program. National Climate Assessment: Heavy Downpours Increasing. http://nca2014.globalchange.gov/report/our-changing-climate/heavy-downpours-increasing ↑
- U.S. Environmental Protection Agency (EPA). Climate Change Indicators: Heavy Precipitation. https://www.epa.gov/climate-indicators/climate-change-indicators-heavy-precipitation ↑
- U.S. Environmental Protection Agency (EPA). Climate Change Indicators: River Flooding. https://www.epa.gov/climate-indicators/climate-change-indicators-river-flooding ↑
- U.S. Environmental Protection Agency (EPA). Climate Change Indicators: Tropical Cyclone Activity. https://www.epa.gov/climate-indicators/climate-change-indicators-tropical-cyclone-activity ↑
- U.S. Department of Agriculture (USDA). Effects of Climate Change on Agriculture. https://www.usda.gov/oce/climate_change/effects_2012/effects_agriculture.htm ↑
- Ibid. ↑
- U.S. Department of Agriculture (USDA). Climate Hub. Focus on Livestock in the Southwest.
https://www.climatehubs.oce.usda.gov/hubs/southwest/topic/focus-livestock-southwest ↑ - U.S. Department of Agriculture (USDA). Effects of Climate Change on Agriculture. https://www.usda.gov/oce/climate_change/effects_2012/effects_agriculture.htm ↑
- Ibid. ↑
- U.S. Center for Disease Control (CDC). Climate Change and Public Health. https://www.cdc.gov/climateandhealth/policy.htm ↑
- Ibid. ↑
- U.S. National Park Service (NPS). The Science of Climate Change in National Parks Video Series.https://www.nps.gov/subjects/climatechange/sciencevideos.htm ↑
- Ibid. ↑
- U.S. Energy Information Administration (EIA). What is U.S. Electricity Generation by Energy Source? https://www.eia.gov/tools/faqs/faq.php?id=427&t=3 ↑
- U.S. Environmental Protection Agency (EPA). Carbon Pollution Standards. https://archive.epa.gov/epa/cleanpowerplan/carbon-pollution-standards-new-modified-and-reconstructed-power-plants-regulatory.html ↑
- Ibid. ↑
- Ibid. ↑
- U.S. Environmental Protection Agency (EPA). Clean Energy Incentive Program. https://www.epa.gov/cleanpowerplan/clean-energy-incentive-program ↑
- U.S. Environmental Protection Agency (EPA). Clean Power Plan Final Rule. https://archive.epa.gov/epa/cleanpowerplan/clean-power-plan-final-rule-table-contents.html ↑
- U.S. Government Publishing Office (GPO). The Clean Power Plan Final Rule. https://www.gpo.gov/fdsys/pkg/FR-2015-10-23/pdf/2015-22842.pdf ↑
- Ibid. ↑
- U.S. Department of State (DOS). 2016. United Nations Framework Convention on Climate Change. Second Biennial Report of the United States of America.https://unfccc.int/files/national_reports/biennial_reports_and_iar/submitted_biennial_reports/application/pdf/2016_second_biennial_report_of_the_united_states_.pdf ↑
- U.S. Environmental Protection Agency (EPA). Regulatory Impact Analysis for the Clean Power Plan Final Rule. https://archive.epa.gov/epa/cleanpowerplan/clean-power-plan-final-rule-regulatory-impact-analysis.html ↑
- Ibid. ↑
- U.S. Energy Information Administration (EIA). Analysis of the Impacts of the Clean Power Plan. https://www.eia.gov/analysis/requests/powerplants/cleanplan/pdf/powerplant.pdf ↑
- Ibid. ↑
- U.S. Environmental Protection Agency (EPA). Regulatory Impact Analysis for the Clean Power Plan Final Rule. https://archive.epa.gov/epa/cleanpowerplan/clean-power-plan-final-rule-regulatory-impact-analysis.html ↑
- National Public Radio (NPR). “EPA Chief: Trump Plans To Kill Obama-Era Clean Power Plan.” April 26, 2017. http://www.npr.org/2017/03/27/521622793/epa-chief-trump-plans-to-kill-obama-era-clean-power-plan ↑
- U.S. Environmental Protection Agency (EPA). Clean Power Plan for Existing Power Plants. https://www.epa.gov/cleanpowerplan/clean-power-plan-existing-power-plants ↑
- U.S. Energy Information Administration (EIA). Analysis of the Impacts of the Clean Power Plan. https://www.eia.gov/analysis/requests/powerplants/cleanplan/pdf/powerplant.pdf ↑
- Pomerleau, Kyle and Andrew Lundeen. “The U.S. Has the Highest Corporate Income Tax Rate in the OECD.” Tax Foundation, 2014. https://taxfoundation.org/us-has-highest-corporate-income-tax-rate-oecd ↑
- Hassett, Kevin A. and Aparna Mathur, “Report Card on Effective Corporate Tax Rates.” American Enterprise Institute, February 9, 2011. http://www.aei.org/publication/report-card-on-effective-corporate-tax-rates/ ↑
- Johansson, Asa, Christopher Heady, Jens Arnold, Bert Brys, and Laura Vartia. “Tax and Economic Growth.” Organization for Economic Cooperation and Development, Economics Department Working Paper No. 620, July 11, 2008. http://www.oecd.org/officialdocuments/publicdisplaydocumentpdf/?doclanguage=en&cote=eco/wkp(2008)28 ↑
- Toder, Eric. “International Competitiveness: Who Competes Against Whom andfor What?” Tax Law Review 65: 505-534, 2012.https://www.taxpolicycenter.org/sites/default/files/alfresco/publication-pdfs/412654-International-Competitiveness-Who-Competes-Against-Whom-and-for-What-.PDF ↑
- U.S. Government Publishing Office (GPO). Budget of the United States Government. https://www.gpo.gov/fdsys/browse/collection.action?collectionCode=BUDGET&browsePath=Fiscal+Year+2018&searchPath=Fiscal+Year+2018&leafLevelBrowse=false&isCollapsed=false&isOpen=true&packageid=BUDGET-2018-TAB&ycord=822 ↑
- U.S. Census Bureau. State and Local Government Finance. https://www.census.gov/govs/local/ ↑
- Brady, Demian. “Tax Complexity 2016: The Increasing Compliance Burdens of the Tax Code.” National Taxpayer Union Foundation, 2016. http://www.ntu.org/foundation/detail/tax-complexity-2016-the-increasing-compliance-burdens-of-the-tax-code ↑
- Metcalf, Gilbert E. “Corporate Tax Reform: Paying the Bills with a Carbon Tax.” Public Finance Review Vol 35, Issue 3, pp. 440 – 459. 2016. http://journals.sagepub.com/doi/pdf/10.1177/1091142107299269 ↑
- Metcalf, Gilbert E. and David Weisbach. “The Design of a Carbon Tax,” Harvard Environmental Law Review, Vol. 33, 2009. https://papers.ssrn.com/sol3/papers.cfm?abstract_id=1324854 ↑
- Marron, Donald and Eric Toder. “Carbon Taxes and Corporate Tax Reform.” Tax Policy Center, 2013. http://www.taxpolicycenter.org/sites/default/files/alfresco/publication-pdfs/412744-Carbon-Taxes-and-Corporate-Tax-Reform.PDF ↑
- Oak Ridge National Laboratory. Center for Transportation Analysis. Transportation Energy Data Book 2018, Table 8.6 Average Number of Vehicles and Vehicle Travel per Household. http://info.ornl.gov/sites/publications/files/Pub31202.pdf ↑
- Chen, Yunguang and Marc A. C. Hafstead. “Using a Carbon Tax to Meet US International Climate Pledges.” Resources for the Future, 2016. http://www.rff.org/files/document/file/RFF-DP-16-48.pdf ↑
- Ibid. ↑
- Ibid. ↑
- U.S. Congressional Budget Office (CBO). Effects of a Carbon Tax on the Economy and the Environment. https://www.cbo.gov/publication/44223. ↑
- U.S. Congressional Budget Office (CBO). How Policies to Reduce Greenhouse Gas Emissions Could Affect Employment. https://www.cbo.gov/sites/default/files/111th-congress-2009-2010/reports/05-05-capandtrade_brief.pdf ↑
- U.S. Department of Energy. U.S. Energy and Employment Report 2018.https://static1.squarespace.com/static/5a98cf80ec4eb7c5cd928c61/t/5afb0ce4575d1f3cdf9ebe36/1526402279839/2018+U.S.+Energy+and+Employment+Report.pdf ↑
- “Now Hiring: The Growth of America’s Clean Energy and Sustainability Jobs.” Environmental Defense Fund. 2017. http://edfclimatecorps.org/nowhiringreport ↑
- International Renewable Energy Agency. Renewable Energy and Jobs – Annual Review 2018. http://irena.org/publications/2018/May/Renewable-Energy-and-Jobs-Annual-Review-2018 ↑
- Pollin, Robert, Jeannette Wicks-Lim, and Heidi Garrett-Peltier. “Green Prosperity: How Clean-Energy Policies Can Fight Poverty and Raise Living Standards in the United States.” Department of Economics andPolitical Economy Research Institute, University of Massachusetts, Amherst, June 2009. https://www.peri.umass.edu/media/k2/attachments/Green_Prosperity.pdf ↑
- McBride, William. “What is the Evidence on Taxes and Growth?” Tax Foundation, 2012. https://files.taxfoundation.org/legacy/docs/sr207.pdf ↑
- Ibid. ↑
- Ibid. ↑
- U.S. Congressional Budget Office (CBO). Effects of a Carbon Tax on the Economy and the Environment. https://www.cbo.gov/publication/44223 ↑
- U.S. Government Publishing Office (GPO). Budget of the United States Government. Table 2.1. Fiscal Year 2017 Historical Tables. https://www.gpo.gov/fdsys/pkg/BUDGET-2017-TAB/pdf/BUDGET-2017-TAB.pdf ↑
- Djankov, Simeon, Tim Ganser, Caralee McLiesh, Rita Ramalho, and Andrei Shleifer. “The Effect of Corporate Taxes on Investment and Entrepreneurship,” National Bureau of Economic Research Working Paper No. 13756, January 2008. http://dx.doi.org/10.2139/ssrn.1091238 ↑
- Ibid. ↑
- Bailey, David and David Bookbinder. “A Winning Trade.” Climate Leadership Council, 2017. https://www.clcouncil.org/wp-content/uploads/2017/02/A_Winning_Trade.pdf ↑
- Ibid. ↑
- Belsie, Laurent. “How Regressive is a Price on Carbon?” The National Bureau of Economic Research. http://www.nber.org/digest/jan10/w15239.html ↑
- U.S. Department of Energy. 2017. U.S. Energy and Employment Report. https://www.energy.gov/sites/prod/files/2017/01/f34/2017%20US%20Energy%20and%20Jobs%20Report_0.pdf ↑
- US. Department of Transportation (DOT). Bureau of Transportation Statistics (BTS). Table 4-23: Average Fuel Efficiency of U.S. Light Duty Vehicles. https://www.bts.gov/archive/publications/national_transportation_statistics/table_04_23 ↑
- Bailey, David and Bookbinder, David. “A Winning Trade.” Climate Leadership Council, 2017. https://www.clcouncil.org/wp-content/uploads/2017/02/A_Winning_Trade.pdf ↑
- Chen, Yunguang and Marc A. C. Hafstead. “Using a Carbon Tax to Meet US International Climate Pledges.” Resources for the Future, 2016. http://www.rff.org/files/document/file/RFF-DP-16-48.pdf ↑
- Ibid. ↑
- Murphy, Robert P., Patrick J. Michaels, Paul C. Knappenberger. “The Case Against a Carbon Tax.” CATO Institute. Working Paper No. 33, September 4, 2015. https://object.cato.org/sites/cato.org/files/pubs/pdf/cato-working-paper-33.pdf ↑
- Soytas, Ugur, Ramazan Sari, and Bradley T. Ewing. “Energy Consumption, Income, And Carbon Emissions In The United States.” Ecological Economics 62.3-4 (2007): 482-489. http://www.sciencedirect.com/science/article/pii/S0921-8009(06)00343-0 ↑
- U.S. Census Bureau. 2005. Supplemental Measures of Material Well-being: Basic Needs, Consumer Durables, Energy, and Poverty, 1981 to 2002. https://www.census.gov/prod/2005pubs/p23-202.pdf ↑
- Halstead, Ted. “Unlocking the Climate Puzzle.” Climate Leadership Council, 2017. https://www.clcouncil.org/wp-content/uploads/2017/02/Unlocking_The_Climate_Puzzle.pdf ↑
- U.S. Department of Treasury. Methodology for Analyzing a Carbon Tax. https://www.treasury.gov/resource-center/tax-policy/tax-analysis/Documents/WP-115.pdf ↑